Previous: Functions and Variables for pictures, Up: draw [Contents][Index]
53.4 Functions and Variables for worldmap
53.4.1 Variables and Functions
- Global variable: boundaries_array 
Default value:
falseboundaries_arrayis where the graphic objectgeomaplooks for boundaries coordinates.Each component of
boundaries_arrayis an array of floating point quantities, the coordinates of a polygonal segment or map boundary.See also
geomap.Categories: Package draw ·
- Function: numbered_boundaries (nlist) 
Draws a list of polygonal segments (boundaries), labeled by its numbers (
boundaries_arraycoordinates). This is of great help when building new geographical entities.Example:
Map of Europe labeling borders with their component number in
boundaries_array.(%i1) load("worldmap")$ (%i2) european_borders: region_boundaries(-31.81,74.92,49.84,32.06)$ (%i3) numbered_boundaries(european_borders)$Categories: Package draw ·
- Function: make_poly_continent
make_poly_continent (continent_name)
make_poly_continent (country_list) ¶ -
Makes the necessary polygons to draw a colored continent or a list of countries.
Example:
(%i1) load("worldmap")$
(%i2) /* A continent */
      make_poly_continent(Africa)$
(%i3) apply(draw2d, %)$
(%i4) /* A list of countries */ make_poly_continent([Germany,Denmark,Poland])$ (%i5) apply(draw2d, %)$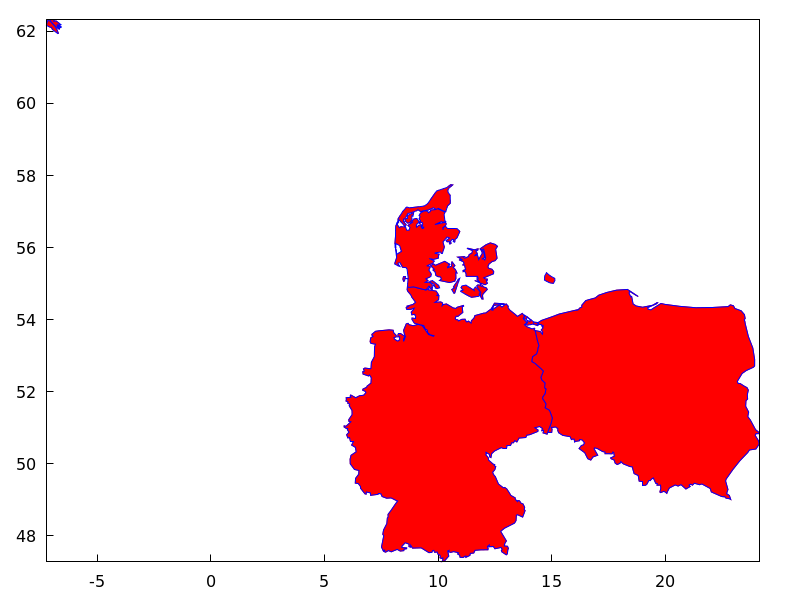 Categories: Package draw ·
- Function: make_poly_country (country_name) 
Makes the necessary polygons to draw a colored country. If islands exist, one country can be defined with more than just one polygon.
Example:
(%i1) load("worldmap")$ (%i2) make_poly_country(India)$ (%i3) apply(draw2d, %)$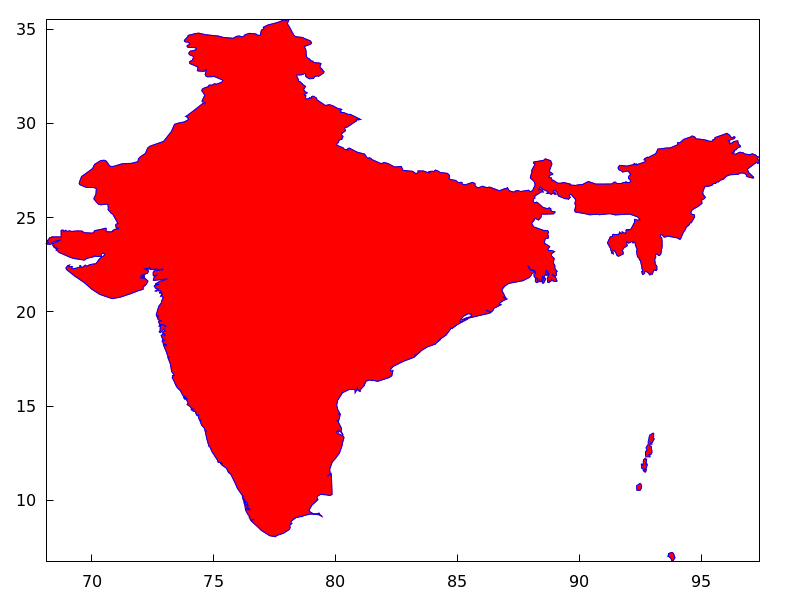 Categories: Package draw ·
- Function: make_polygon (nlist) 
Returns a
polygonobject from boundary indices. Argument nlist is a list of components ofboundaries_array.Example:
Bhutan is defined by boundary numbers 171, 173 and 1143, so that
make_polygon([171,173,1143])appends arrays of coordinatesboundaries_array[171],boundaries_array[173]andboundaries_array[1143]and returns apolygonobject suited to be plotted bydraw. To avoid an error message, arrays must be compatible in the sense that any two consecutive arrays have two coordinates in the extremes in common. In this example, the two first components ofboundaries_array[171]are equal to the last two coordinates ofboundaries_array[173], and the two first ofboundaries_array[173]are equal to the two first ofboundaries_array[1143]; in conclusion, boundary numbers 171, 173 and 1143 (in this order) are compatible and the colored polygon can be drawn.(%i1) load("worldmap")$ (%i2) Bhutan; (%o2) [[171, 173, 1143]] (%i3) boundaries_array[171]; (%o3) {Array: #(88.750549 27.14727 88.806351 27.25305 88.901367 27.282221 88.917877 27.321039)} (%i4) boundaries_array[173]; (%o4) {Array: #(91.659554 27.76511 91.6008 27.66666 91.598022 27.62499 91.631348 27.536381 91.765533 27.45694 91.775253 27.4161 92.007751 27.471939 92.11441 27.28583 92.015259 27.168051 92.015533 27.08083 92.083313 27.02277 92.112183 26.920271 92.069977 26.86194 91.997192 26.85194 91.915253 26.893881 91.916924 26.85416 91.8358 26.863331 91.712479 26.799999 91.542191 26.80444 91.492188 26.87472 91.418854 26.873329 91.371353 26.800831 91.307457 26.778049 90.682457 26.77417 90.392197 26.903601 90.344131 26.894159 90.143044 26.75333 89.98996 26.73583 89.841919 26.70138 89.618301 26.72694 89.636093 26.771111 89.360786 26.859989 89.22081 26.81472 89.110237 26.829161 88.921631 26.98777 88.873016 26.95499 88.867737 27.080549 88.843307 27.108601 88.750549 27.14727)} (%i5) boundaries_array[1143]; (%o5) {Array: #(91.659554 27.76511 91.666924 27.88888 91.65831 27.94805 91.338028 28.05249 91.314972 28.096661 91.108856 27.971109 91.015808 27.97777 90.896927 28.05055 90.382462 28.07972 90.396088 28.23555 90.366074 28.257771 89.996353 28.32333 89.83165 28.24888 89.58609 28.139999 89.35997 27.87166 89.225517 27.795 89.125793 27.56749 88.971077 27.47361 88.917877 27.321039)} (%i6) Bhutan_polygon: make_polygon([171,173,1143])$ (%i7) draw2d(Bhutan_polygon)$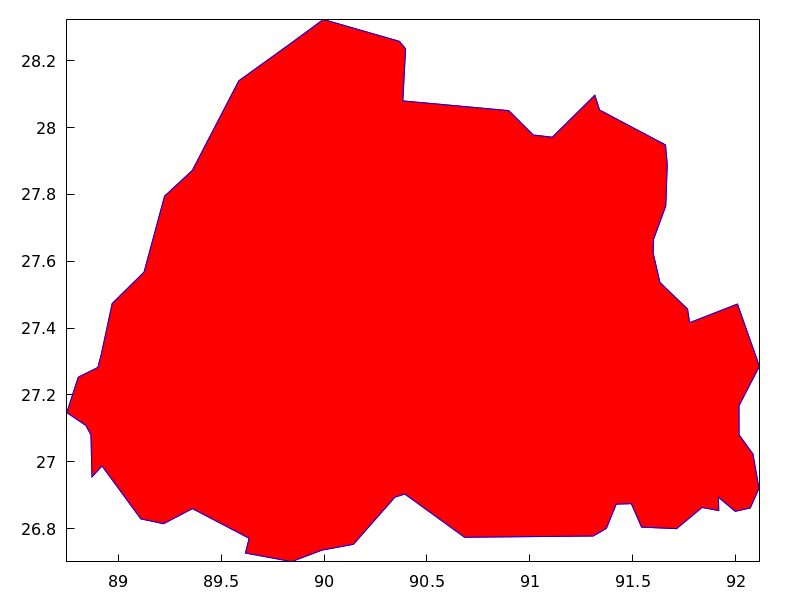 Categories: Package draw ·
- Function: region_boundaries (x1,y1,x2,y2) 
Detects polygonal segments of global variable
boundaries_arrayfully contained in the rectangle with vertices (x1,y1) -upper left- and (x2,y2) -bottom right-.Example:
Returns segment numbers for plotting southern Italy.
(%i1) load("worldmap")$ (%i2) region_boundaries(10.4,41.5,20.7,35.4); (%o2) [1846, 1863, 1864, 1881, 1888, 1894] (%i3) draw2d(geomap(%))$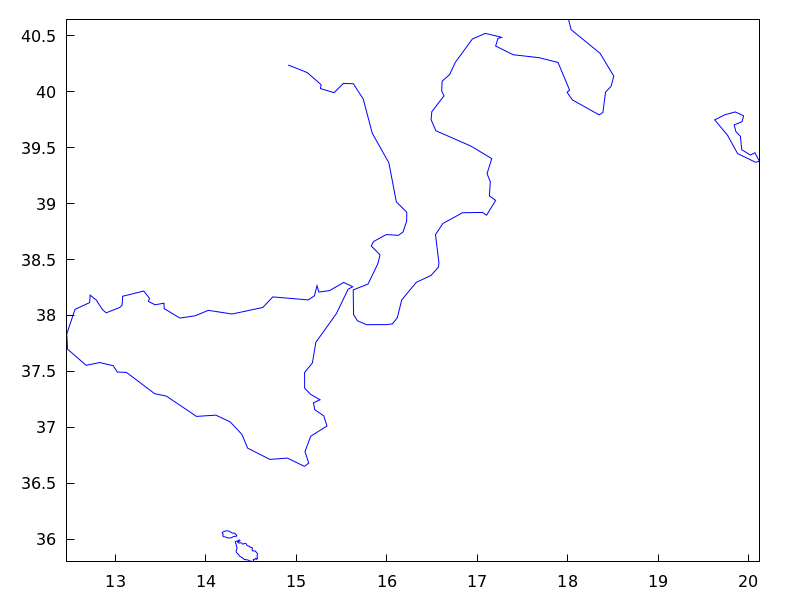 Categories: Package draw ·
- Function: region_boundaries_plus (x1,y1,x2,y2) 
Detects polygonal segments of global variable
boundaries_arraycontaining at least one vertex in the rectangle defined by vertices (x1,y1) -upper left- and (x2,y2) -bottom right-.Example:
(%i1) load("worldmap")$ (%i2) region_boundaries_plus(10.4,41.5,20.7,35.4); (%o2) [1060, 1062, 1076, 1835, 1839, 1844, 1846, 1858, 1861, 1863, 1864, 1871, 1881, 1888, 1894, 1897] (%i3) draw2d(geomap(%))$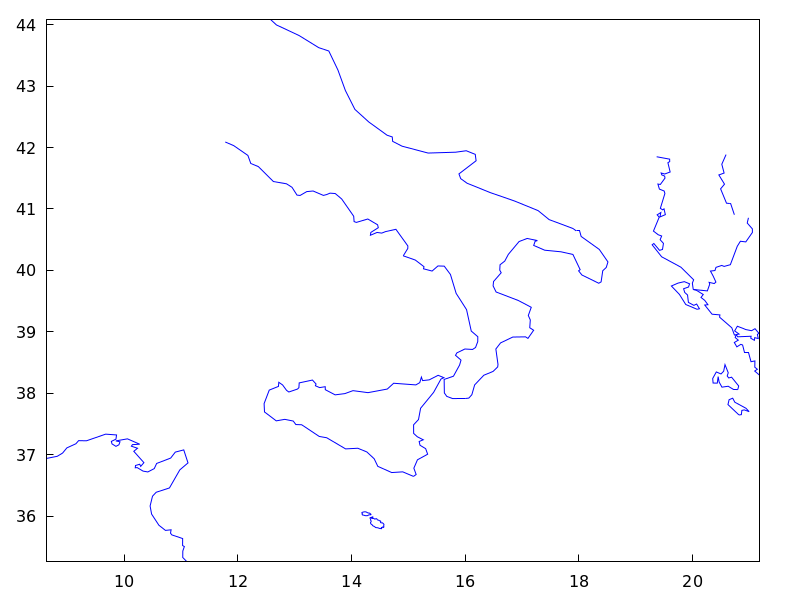 Categories: Package draw ·
53.4.2 Graphic objects
- Graphic object: geomap
geomap (numlist)
geomap (numlist,3Dprojection) ¶ -
Draws cartographic maps in 2D and 3D.
2D
This function works together with global variable
boundaries_array.Argument numlist is a list containing numbers or lists of numbers. All these numbers must be integers greater or equal than zero, representing the components of global array
boundaries_array.Each component of
boundaries_arrayis an array of floating point quantities, the coordinates of a polygonal segment or map boundary.geomap (numlist)flattens its arguments and draws the associated boundaries inboundaries_array.This object is affected by the following graphic options:
line_width,line_typeandcolor.Examples:
A simple map defined by hand:
(%i1) load("worldmap")$
(%i2) /* Vertices of boundary #0: {(1,1),(2,5),(4,3)} */
   ( bnd0: make_array(flonum,6),
     bnd0[0]:1.0, bnd0[1]:1.0, bnd0[2]:2.0,
     bnd0[3]:5.0, bnd0[4]:4.0, bnd0[5]:3.0 )$
(%i3) /* Vertices of boundary #1: {(4,3),(5,4),(6,4),(5,1)} */
   ( bnd1: make_array(flonum,8),
     bnd1[0]:4.0, bnd1[1]:3.0, bnd1[2]:5.0, bnd1[3]:4.0,
     bnd1[4]:6.0, bnd1[5]:4.0, bnd1[6]:5.0, bnd1[7]:1.0)$
(%i4) /* Vertices of boundary #2: {(5,1), (3,0), (1,1)} */
   ( bnd2: make_array(flonum,6),
     bnd2[0]:5.0, bnd2[1]:1.0, bnd2[2]:3.0,
     bnd2[3]:0.0, bnd2[4]:1.0, bnd2[5]:1.0 )$
(%i5) /* Vertices of boundary #3: {(1,1), (4,3)} */
   ( bnd3: make_array(flonum,4),
     bnd3[0]:1.0, bnd3[1]:1.0, bnd3[2]:4.0, bnd3[3]:3.0)$
(%i6) /* Vertices of boundary #4: {(4,3), (5,1)} */
   ( bnd4: make_array(flonum,4),
     bnd4[0]:4.0, bnd4[1]:3.0, bnd4[2]:5.0, bnd4[3]:1.0)$
(%i7) /* Pack all together in boundaries_array */
   ( boundaries_array: make_array(any,5),
     boundaries_array[0]: bnd0, boundaries_array[1]: bnd1,
     boundaries_array[2]: bnd2, boundaries_array[3]: bnd3,
     boundaries_array[4]: bnd4 )$
(%i8) draw2d(geomap([0,1,2,3,4]))$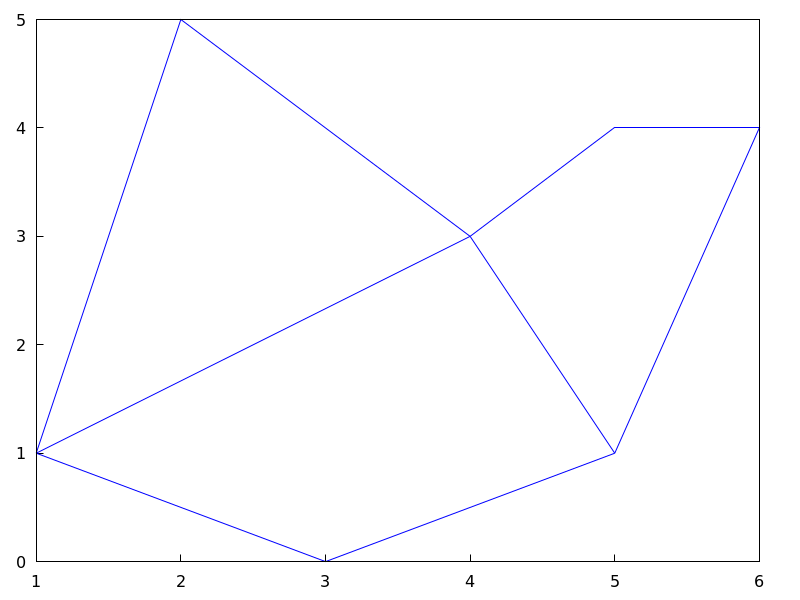
The auxiliary package
worldmapsets the global variableboundaries_arrayto real world boundaries in (longitude, latitude) coordinates. These data are in the public domain and come from https://web.archive.org/web/20100310124019/http://www-cger.nies.go.jp/grid-e/gridtxt/grid19.html. Packageworldmapdefines also boundaries for countries, continents and coastlines as lists with the necessary components ofboundaries_array(see fileshare/draw/worldmap.macfor more information). Packageworldmapautomatically loads packageworldmap.(%i1) load("worldmap")$ (%i2) c1: gr2d(geomap([Canada,United_States, Mexico,Cuba]))$ (%i3) c2: gr2d(geomap(Africa))$ (%i4) c3: gr2d(geomap([Oceania,China,Japan]))$ (%i5) c4: gr2d(geomap([France,Portugal,Spain, Morocco,Western_Sahara]))$ (%i6) draw(columns = 2, c1,c2,c3,c4)$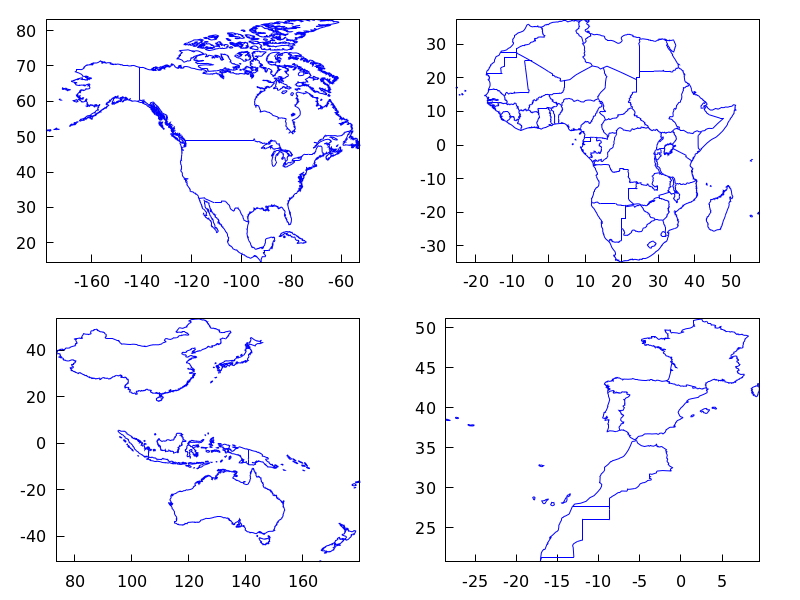
Package
worldmapis also useful for plotting countries as polygons. In this case, graphic objectgeomapis no longer necessary and thepolygonobject is used instead. Since lists are now used and not arrays, maps rendering will be slower. See alsomake_poly_countryandmake_poly_continentto understand the following code.(%i1) load("worldmap")$ (%i2) mymap: append( [color = white], /* borders are white */ [fill_color = red], make_poly_country(Bolivia), [fill_color = cyan], make_poly_country(Paraguay), [fill_color = green], make_poly_country(Colombia), [fill_color = blue], make_poly_country(Chile), [fill_color = "#23ab0f"], make_poly_country(Brazil), [fill_color = goldenrod], make_poly_country(Argentina), [fill_color = "midnight-blue"], make_poly_country(Uruguay))$ (%i3) apply(draw2d, mymap)$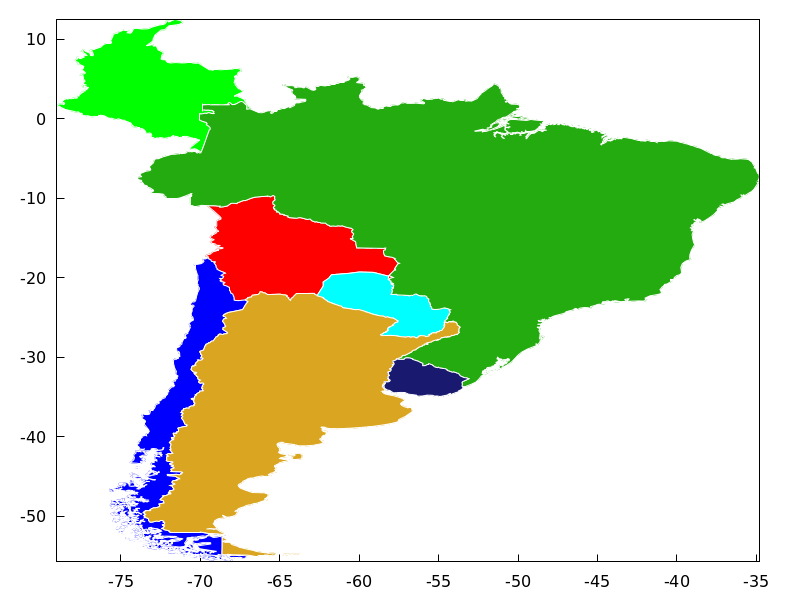
3D
geomap (numlist)projects map boundaries on the sphere of radius 1 centered at (0,0,0). It is possible to change the sphere or the projection type by usinggeomap (numlist,3Dprojection).Available 3D projections:
-
[spherical_projection,x,y,z,r]: projects map boundaries on the sphere of radius r centered at (x,y,z).(%i1) load("worldmap")$ (%i2) draw3d(geomap(Australia), /* default projection */ geomap(Australia, [spherical_projection,2,2,2,3]))$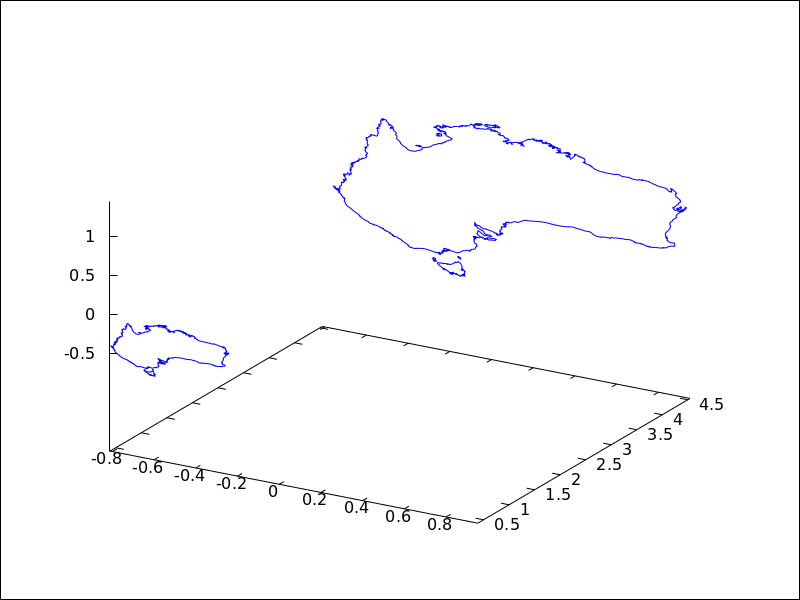
-
[cylindrical_projection,x,y,z,r,rc]: re-projects spherical map boundaries on the cylinder of radius rc and axis passing through the poles of the globe of radius r centered at (x,y,z).(%i1) load("worldmap")$ (%i2) draw3d(geomap([America_coastlines,Eurasia_coastlines], [cylindrical_projection,2,2,2,3,4]))$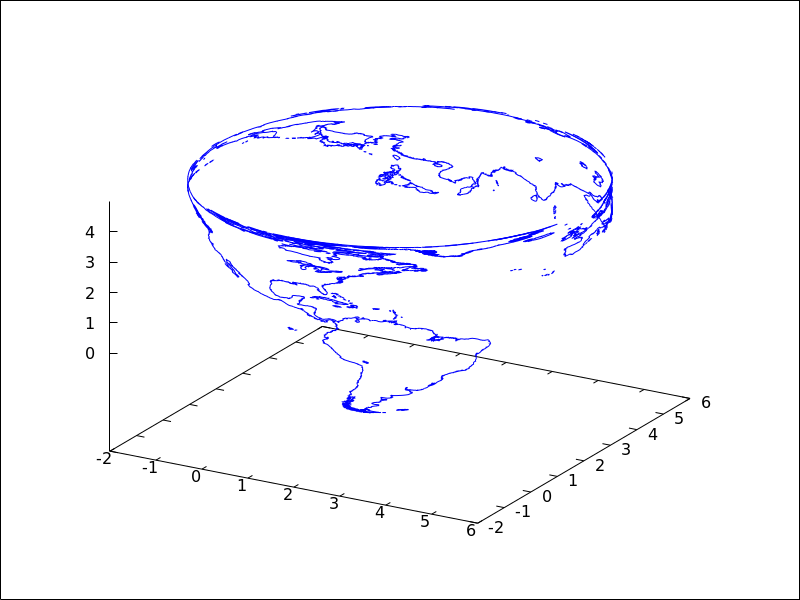
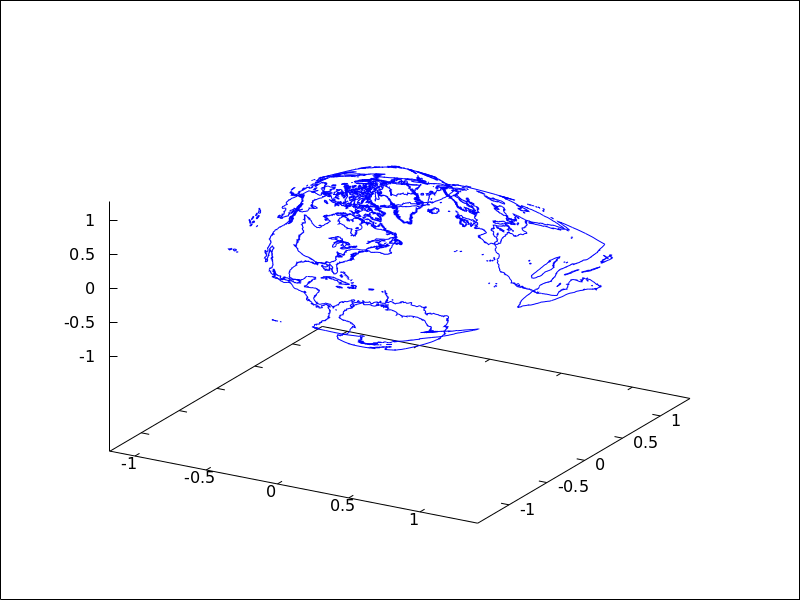
-
[conic_projection,x,y,z,r,alpha]: re-projects spherical map boundaries on the cones of angle alpha, with axis passing through the poles of the globe of radius r centered at (x,y,z). Both the northern and southern cones are tangent to sphere.(%i1) load("worldmap")$ (%i2) draw3d(geomap(World_coastlines, [conic_projection,0,0,0,1,90]))$
See also http://riotorto.users.sf.net/gnuplot/geomap for more elaborated examples.
Categories: Package draw · -